Finding true bottom
Accurate dredge surveys – in oceans, seas, lakes and rivers – are a crucial part of ensuring safe, navigable waters and sound infrastructure installations. The data they collect is used for multiple reasons, including determining material removal requirements, ensuring uniformity of depth, and ensuring environmental and safety requirements are met.
To accurately determine the true bottom during dredge surveys, identifying areas of soft or suspended sediments is a particularly crucial focus. To this end, multifrequency multibeam technology is proving itself invaluable, increasing the information derived from a one-pass multibeam survey by a factor of two.
Determining true bottom
Multibeam echosounders are the sonar of choice for true bottom identification surveys due to their ability to cover 100 % of the bottom and their excellent resolution. Higher multibeam frequencies (400 kHz) provide better horizontal resolution in an area but are shoal-biased in regions of suspended or soft sediments. Conversely, lower multibeam frequencies (200 kHz) can penetrate further into suspended or soft sediments.
Until recently, surveyors using a multibeam echosounder either had to use multiple sonars, each tuned at different frequencies or use one sonar over multiple passes, and tuned to different frequencies for each pass. This would then generate the two surfaces required for comparison. Unfortunately, neither of these alternatives is practical. R2Sonic multibeam echosounders have the exclusive capability to interleave two different frequencies. Using an R2Sonic multibeam echosounder in dual-frequency mode yields “two” bottoms in areas of suspended sediment. Comparing the high-frequency surface with the low-frequency surface provides information on the thickness of the suspended sediment layer, all in one pass. This allows rapid data collection of insightful information for dredgers, who can then plan the dredging work accordingly.

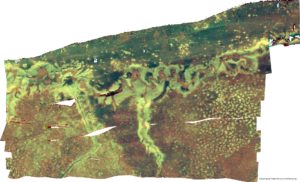
Bathymetry Dual-Frequency at 170kHz and 450kHz

Bathymetry Dual-Frequency at 170kHz and 425kHz

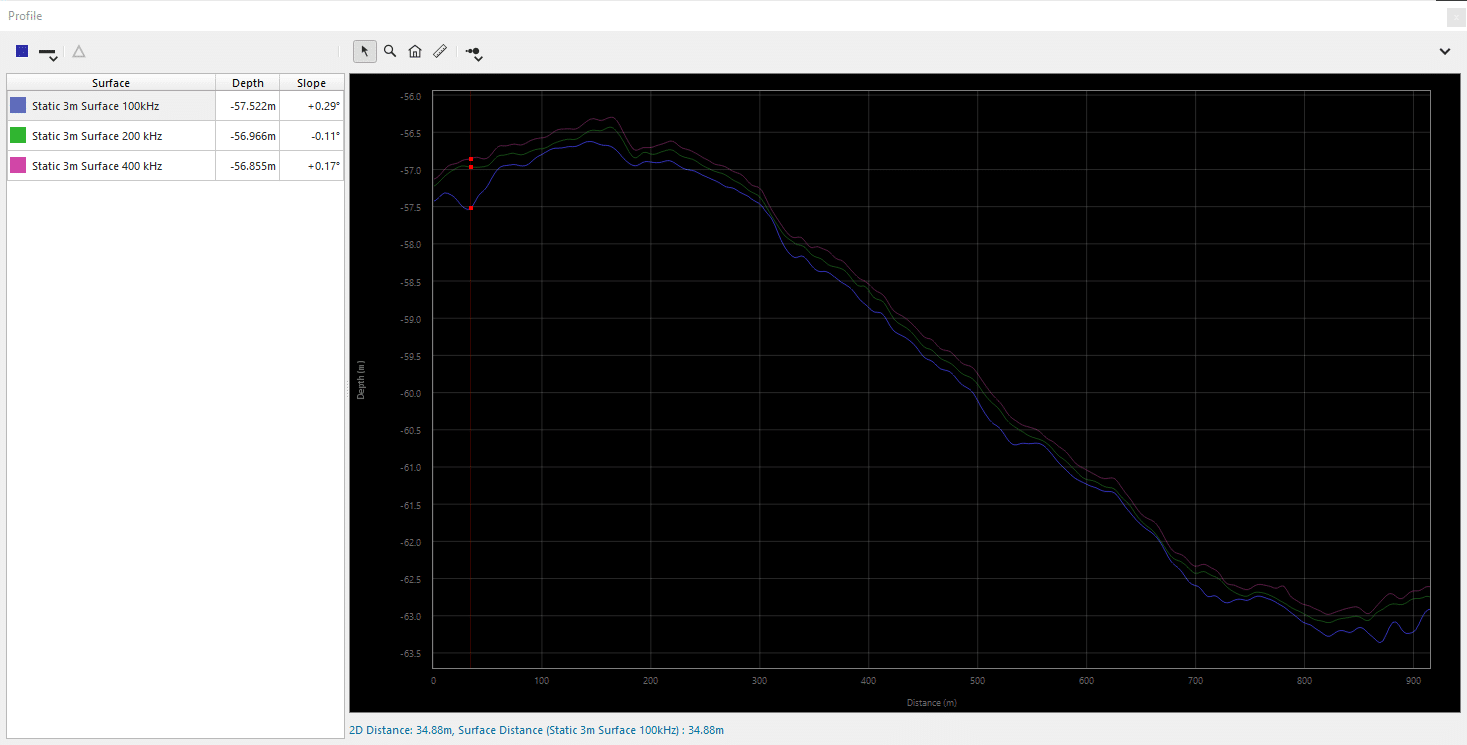
Bathymetric differences at 3 different frequencies: 100kHz, 200kHz and 400kHz


